
Global digital ad spend just hit $835 billion in 2026, and performance-based campaigns now control 60% of all display advertising budgets.
Marketers are ditching guesswork and pouring money into channels that deliver measurable ROI and trackable conversions.
We've researched and collected the latest Performance Marketing Statistics to help you benchmark spend, optimize paid campaigns, and make smarter budget decisions.
From programmatic advertising and search marketing to affiliate networks and retail media, these numbers reveal where the money flows and what actually drives results in 2026.
Global Digital Ad Spend & Market Growth 1
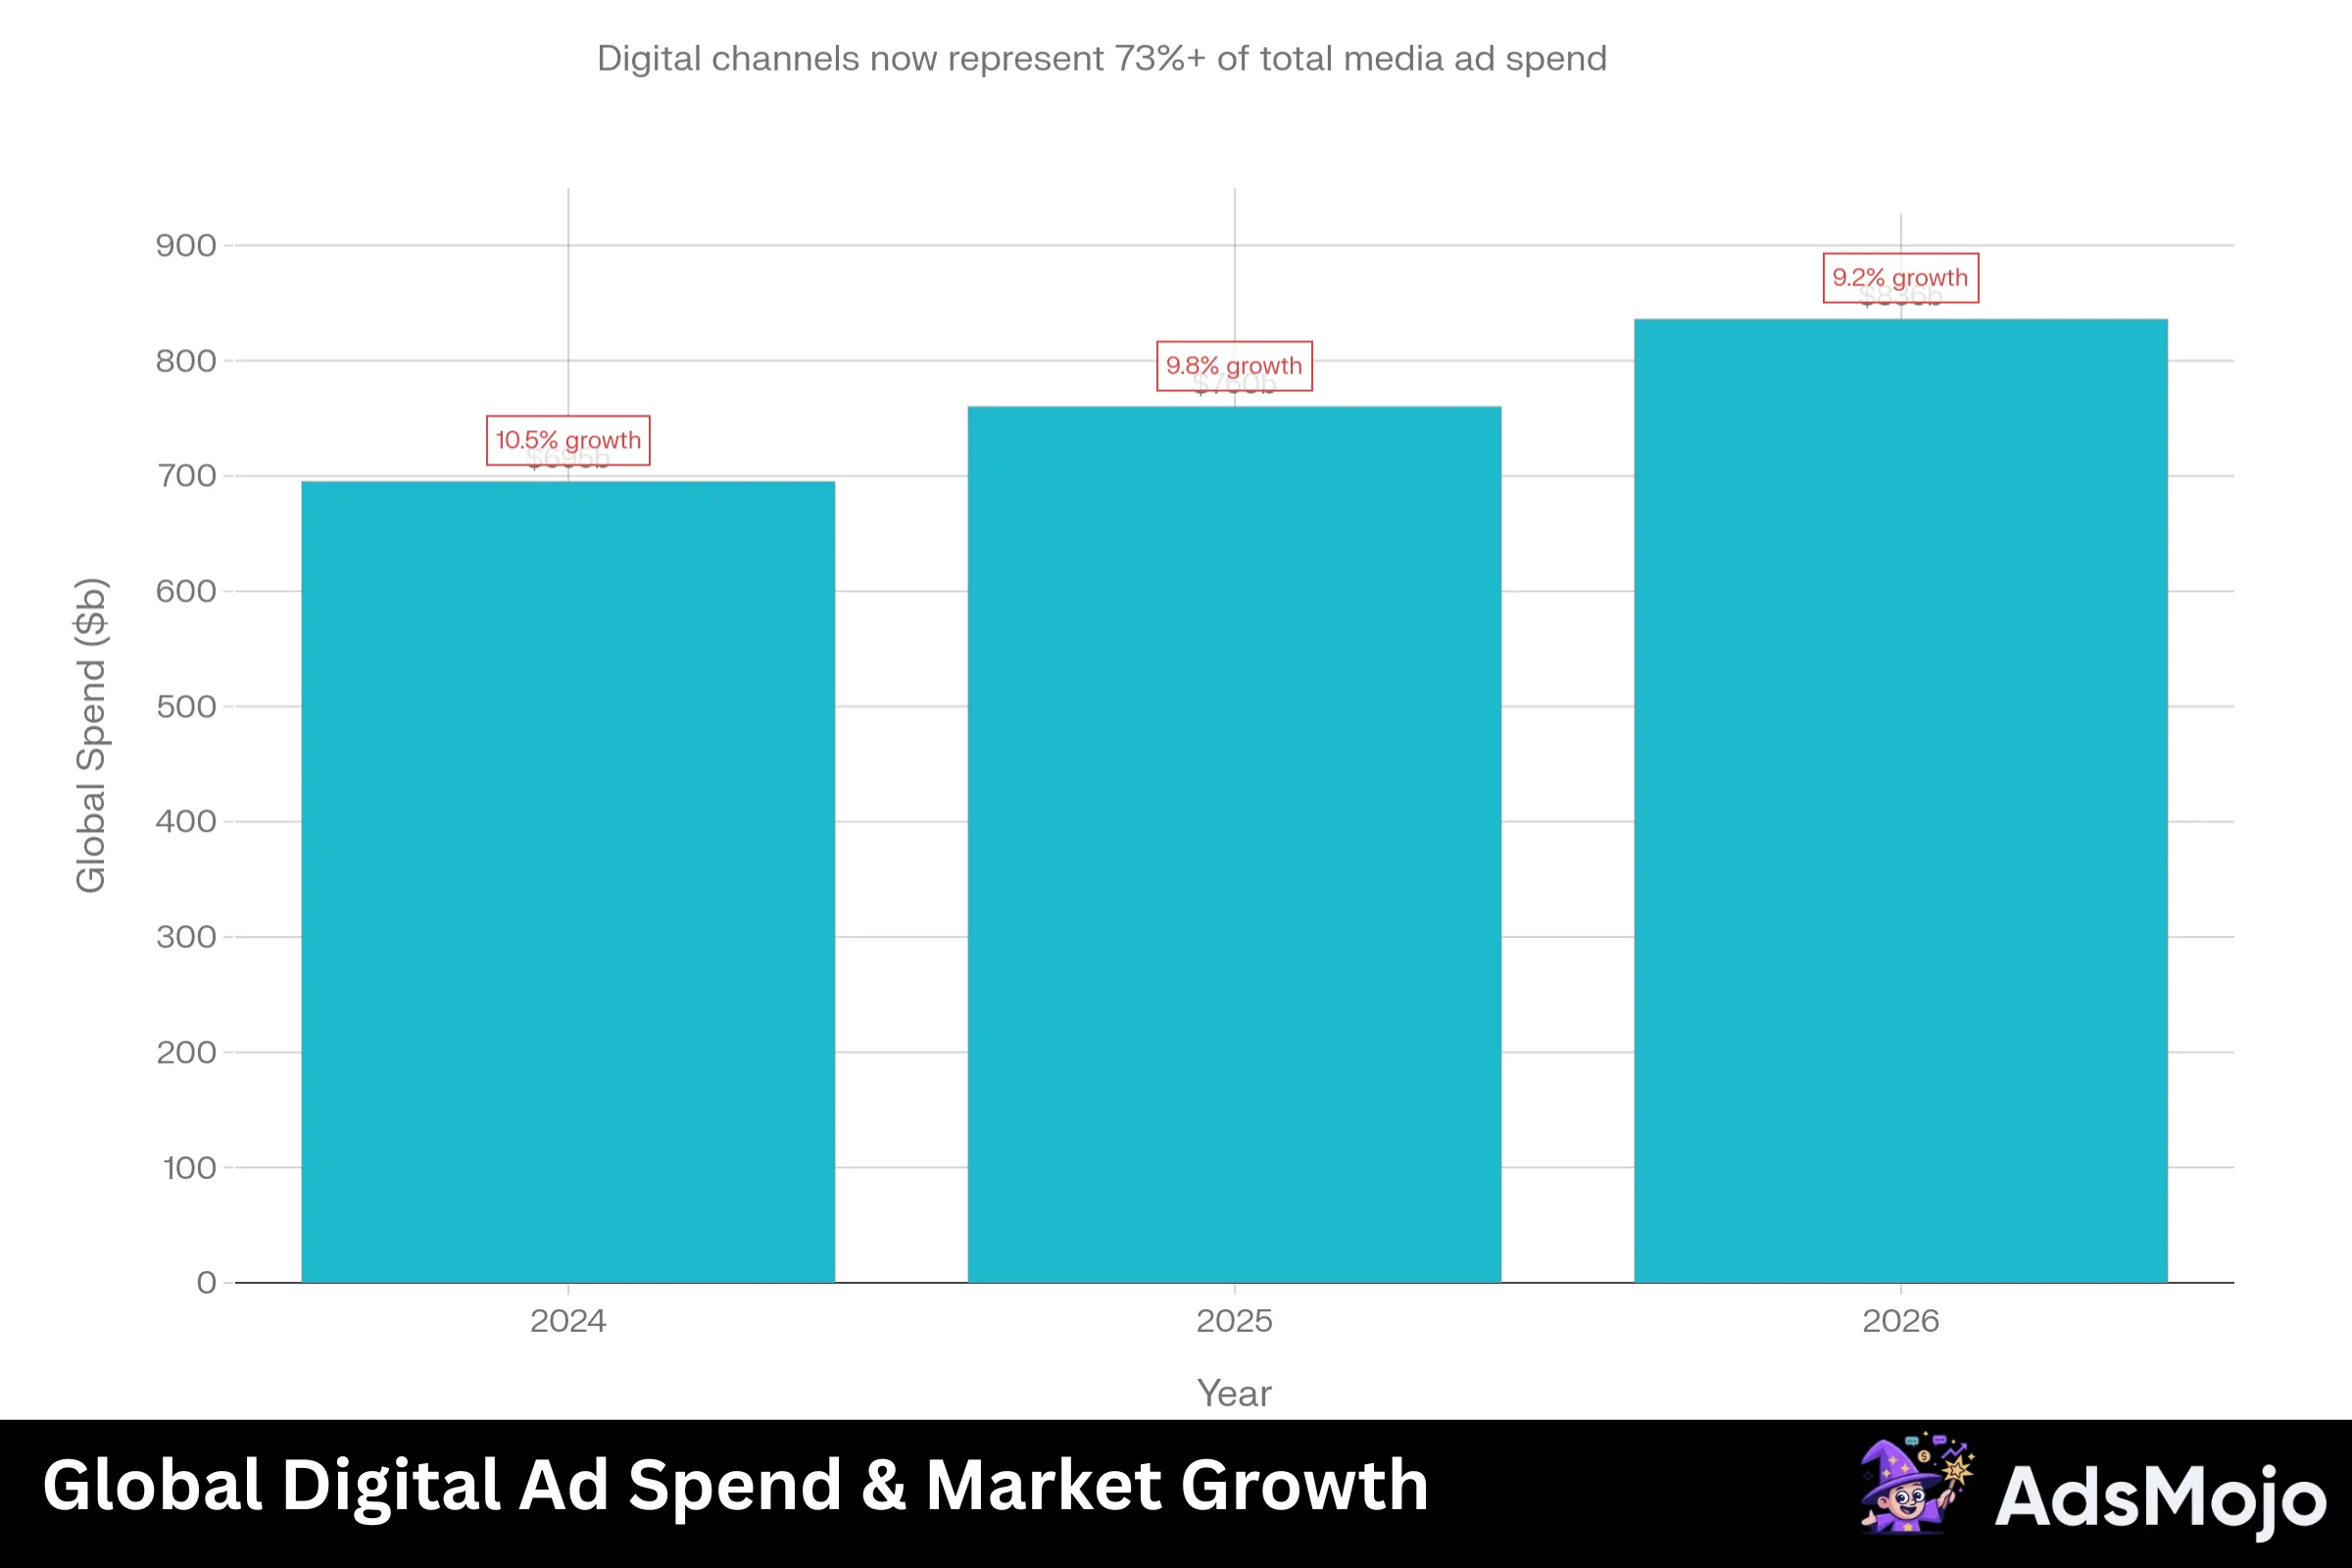
The digital advertising market continues to expand rapidly as brands demand accountability for every dollar spent.
Projected Digital Ad Spend Growth (2024–2026)
| Year | Global Spend (Estimated) | YoY Growth Rate |
|---|---|---|
| 2024 | $695 Billion | 10.5% |
| 2025 | $760 Billion | 9.8% |
| 2026 | $836 Billion+ | 9.2% |
Marketers are heavily increasing investment in channels where return on ad spend (ROAS) is easiest to track and optimize.
Search Engine Marketing Benchmarks for Performance Ad Campaigns 2
Paid search remains the backbone of performance marketing due to its high commercial intent.
Search ads provide immediate visibility and remain critical for capturing bottom-of-funnel traffic.
Affiliate Marketing Industry Hits $20 Billion in 2026 3
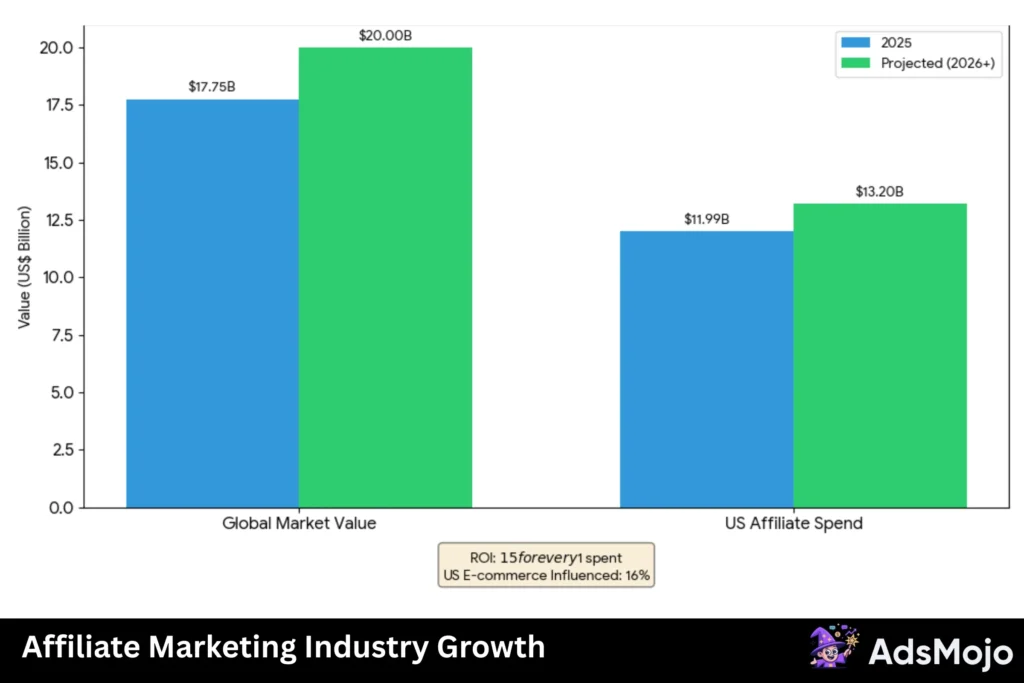
Affiliate marketing is among purest forms of performance-based marketing. Brands pay only for confirmed sales or leads generated through partners.
| Metric | Value |
|---|---|
| Global affiliate market value (2025) | US $17–18.5 billion |
| Projected value (2026) | US $20+ billion |
| US affiliate spend (2025) | US $11.99 billion |
| US affiliate spend (2026) | US $13.2 billion |
| Average ROI | US $15 for every US $1 spent |
| Share of US e-commerce influenced | 16% |
Key facts:
Affiliate partnerships offer a cost-effective customer acquisition strategy with predictable ROI for 2026.
Social Media Advertising Statistics and Spending Trends 4
Social platforms are evolving into massive performance engines, with spend growing at double-digit rates despite maturity.
Advertisers are spending roughly US$5 billion per week on social ads globally, with AI-driven targeting improving conversion rates on platforms like TikTok and Instagram.
Regional Ad Spend: Which Markets Grow Fastest 5
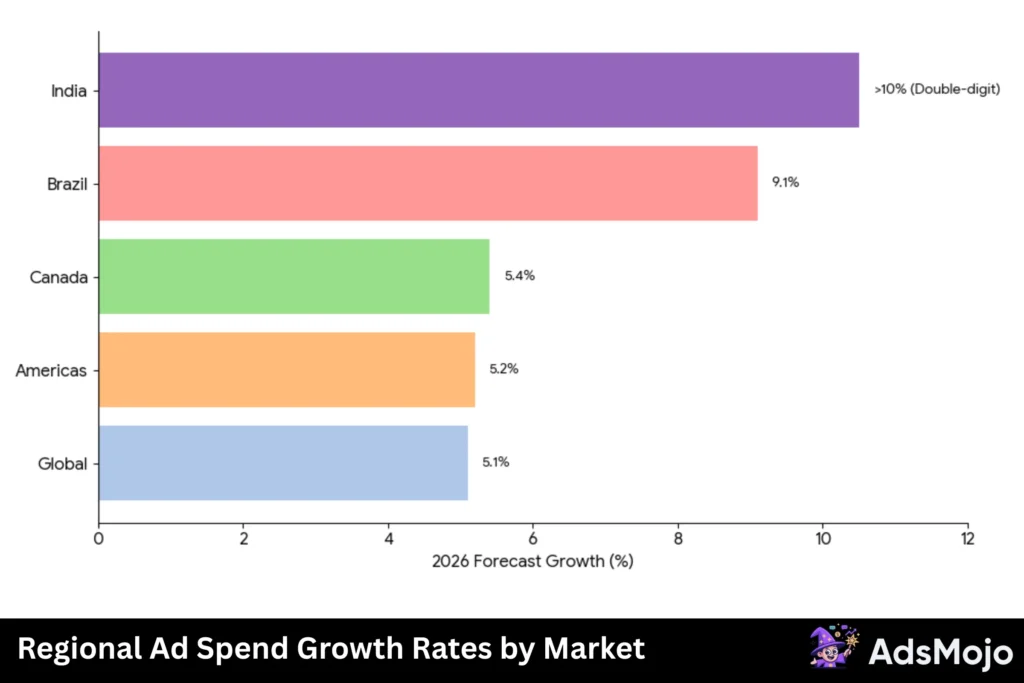
Performance marketing is a global phenomenon, but some regions are accelerating faster than others due to digital adoption.
| Region | 2026 Forecast Growth | Key Driver |
|---|---|---|
| Global | +5.1% | AI & Retail Media |
| Americas | +5.2% | US Elections & World Cup |
| Brazil | +9.1% | Digital Retail Media |
| India | High Growth | Mobile & Social |
| Canada | +5.4% | Digital Platforms |
Programmatic Display Advertising Trends 6
Automation in ad buying allows for real-time targeting and efficiency at an unprecedented scale.
The global programmatic market is valued at approximately $600 billion currently.
Automation is now total: by 2026, the share of display ads bought programmatically is forecast to hit 96.8% of new ad dollars, effectively ending manual insertion orders.
Influencer Performance Marketing 7
Influencer marketing is shedding its “awareness only” reputation and becoming a hard performance channel.
Brands are increasingly paying influencers on a hybrid model (flat fee + commission), aligning creator incentives with brand sales goals.
Why Email Remains the Highest ROI Marketing Channel 8
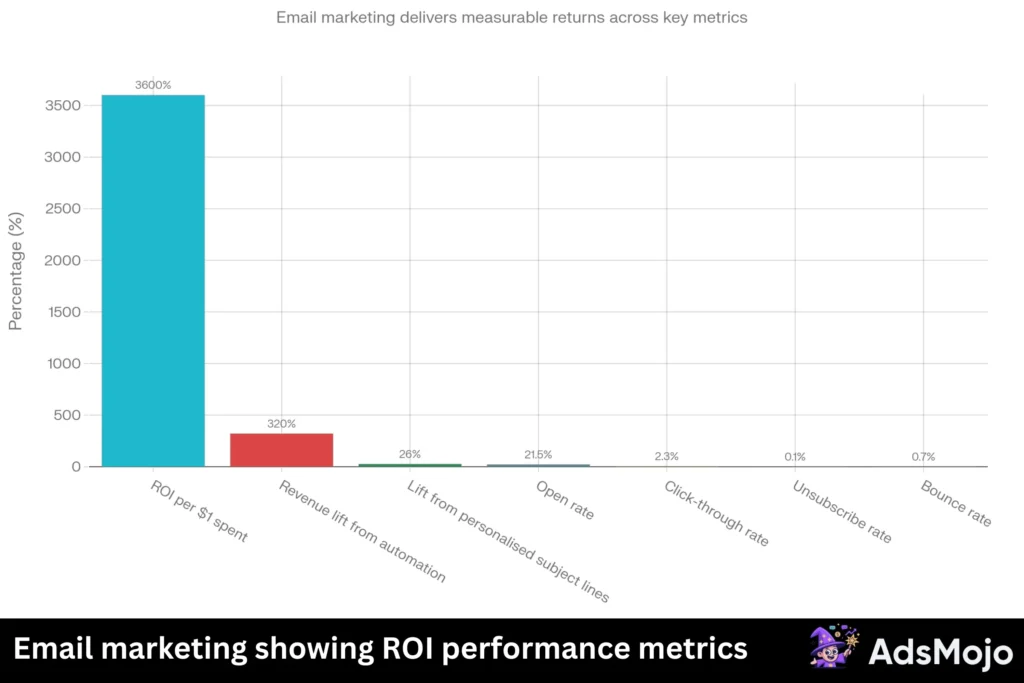
Email remains the highest ROI channel for performance marketers focused on customer retention.
Email Performance Benchmarks (2026)
| Metric | Average Rate |
|---|---|
| Open Rate | 21.5% |
| Click-Through Rate (CTR) | 2.3% |
| Unsubscribe Rate | 0.1% |
| Bounce Rate | 0.7% |
Retention strategies rely heavily on email to maximize customer lifetime value (CLTV).
Mobile Performance Marketing Spend, Installs, And ROAS Trends
With mobile devices driving half of all commerce, app-first performance strategies are non-negotiable.
App install campaigns are becoming more expensive, driving a shift towards retargeting existing users to boost LTV rather than just acquiring new installs.
Ad Fraud Costs Advertisers $136 Billion in 2026
As spend increases, so does fraud. Performance marketers must budget for significant “leakage” due to invalid traffic.
- Global ad fraud costs are projected to reach roughly US$136 billion in 2026, rising to US$172 billion by 2028.
- Non-human traffic accounts for a significant portion of digital activity, with some sources estimating nearly 20% of programmatic CTV traffic is invalid.
- North America is expected to suffer the highest economic losses from ad fraud due to high CPCs and CPMs.
Marketers are responding by using verification tools and shifting budgets to private marketplaces (PMPs) where inventory quality is higher.
Retail Media Growth Statistics and Market Share Trends 9
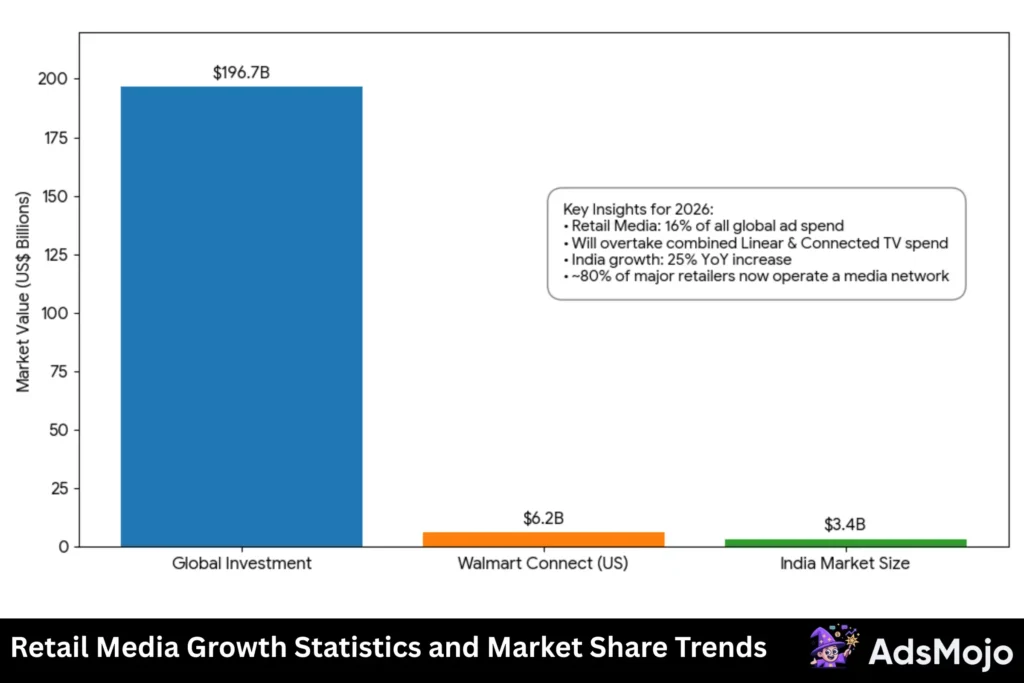
Retail media is the fastest-growing advertising channel, allowing brands to reach shoppers directly at the point of purchase.
| Metric | 2026 Forecast / Stat |
|---|---|
| Global Investment | Set to reach US$196.7 billion in 2026, representing 16% of all ad spend. |
| US Off-Site Spend | Forecast to grow significantly, with Walmart Connect revenue doubling to US$6.2 billion by 2026. |
| Market Share | Retail media will overtake combined linear and connected TV spend in 2026. |
| India Growth | Retail media in India is forecast to rise 25% in 2026, reaching nearly US$3.4 billion. |
Nearly 80% of major retailers now operate a media network, monetising their first-party shopper data to offer closed-loop attribution to performance advertisers.
Video Marketing & Consumption 10
Video content is the preferred format for consumers, driving higher engagement and recall.
Video Ad Spend Share by Device
| Device Type | Share of Spend |
|---|---|
| Mobile | 65% |
| Desktop | 12% |
| Connected TV (CTV) | 23% |
Short-form video is essential for capturing attention in a crowded digital feed.
CRO Benchmarks: How Your Conversion Rates Compare 11
Driving traffic is useless without conversions, making CRO a top priority for performance teams.
Average cost per lead is $70.11 on Google Ads and $27.66 on Facebook Ads.
Customer Acquisition Cost (CAC) Trends 12
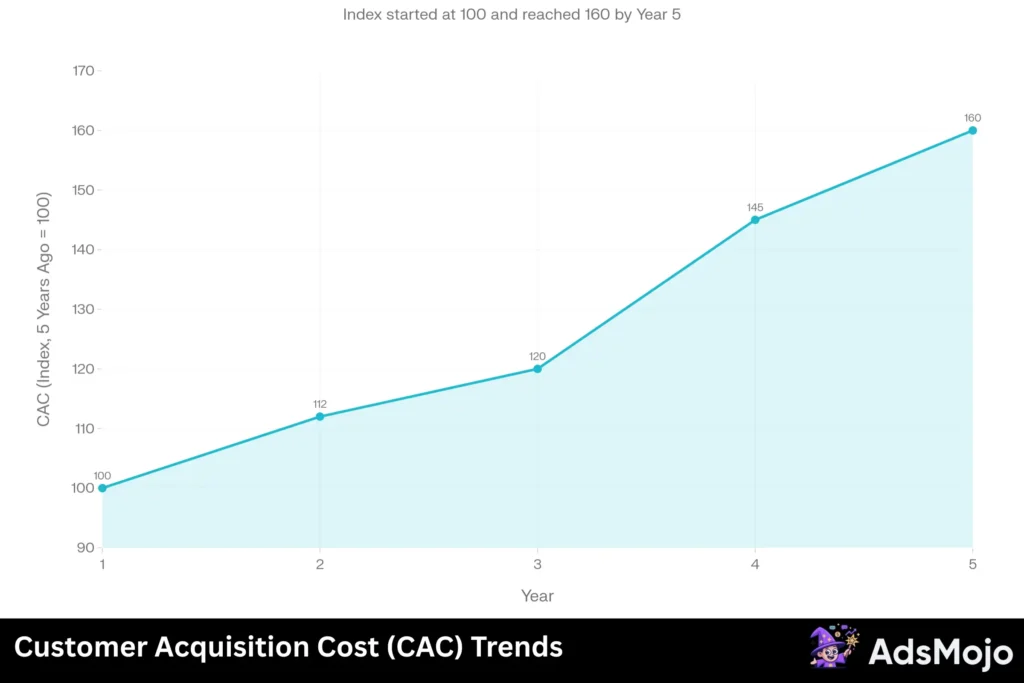
Rising competition and privacy changes are driving up the cost of acquiring new customers.
Brands are combating rising costs by focusing on increasing customer retention rates.
SEO Performance Statistics: Rankings, Traffic, and AI Overviews 13
Organic search remains a vital channel for lowering blended costs and building long-term authority.
Integrating SEO with paid strategies ensures maximum visibility on search engine results pages.
B2B Marketing Stats: LinkedIn Revenue Hits $10 Billion
B2B marketers face longer sales cycles and require different strategies than B2C counterparts.
Top B2B Content Channels
| Channel | Effectiveness Rating |
|---|---|
| High | |
| High | |
| Webinars | Medium-High |
| Twitter/X | Low |
Building trust through educational content is the primary driver of B2B conversions.
User Generated Content (UGC) Impact 14
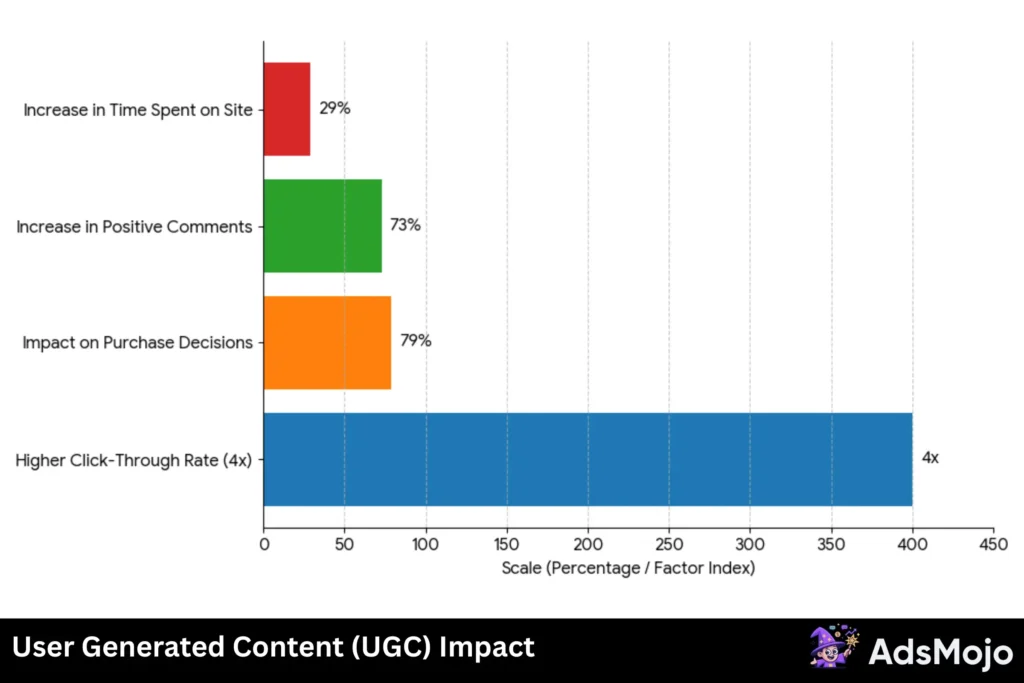
Authentic content created by users outperforms polished studio content in many performance campaigns.
- Ads featuring user-generated content result in 73% more positive comments.
- 79% of people say UGC highly impacts their purchasing decisions.
- Websites with UGC galleries see a 29% increase in time spent on site.
- UGC-based ads achieve a 4x higher click-through rate than traditional ads.
Encouraging customers to share their experiences creates a powerful library of high-performing assets.
Audio Advertising Statistics and Listener Engagement Benchmarks 15
Audio ads offer a captive audience and high engagement rates for performance brands.
Audio allows brands to reach consumers during screen-free moments like commuting or exercising.
Key Takeaways: Where to Invest Your Ad Budget
Performance marketing is no longer optional. Brands allocating budgets to measurable advertising channels are winning in 2026.
Programmatic ad buying now controls 91% of display spend. Customer acquisition costs jumped 60% in five years, making first-party data strategies essential.
Success demands smarter spending, not bigger budgets.
Which performance marketing channel will you prioritise for maximum return on ad spend?
